Return to home
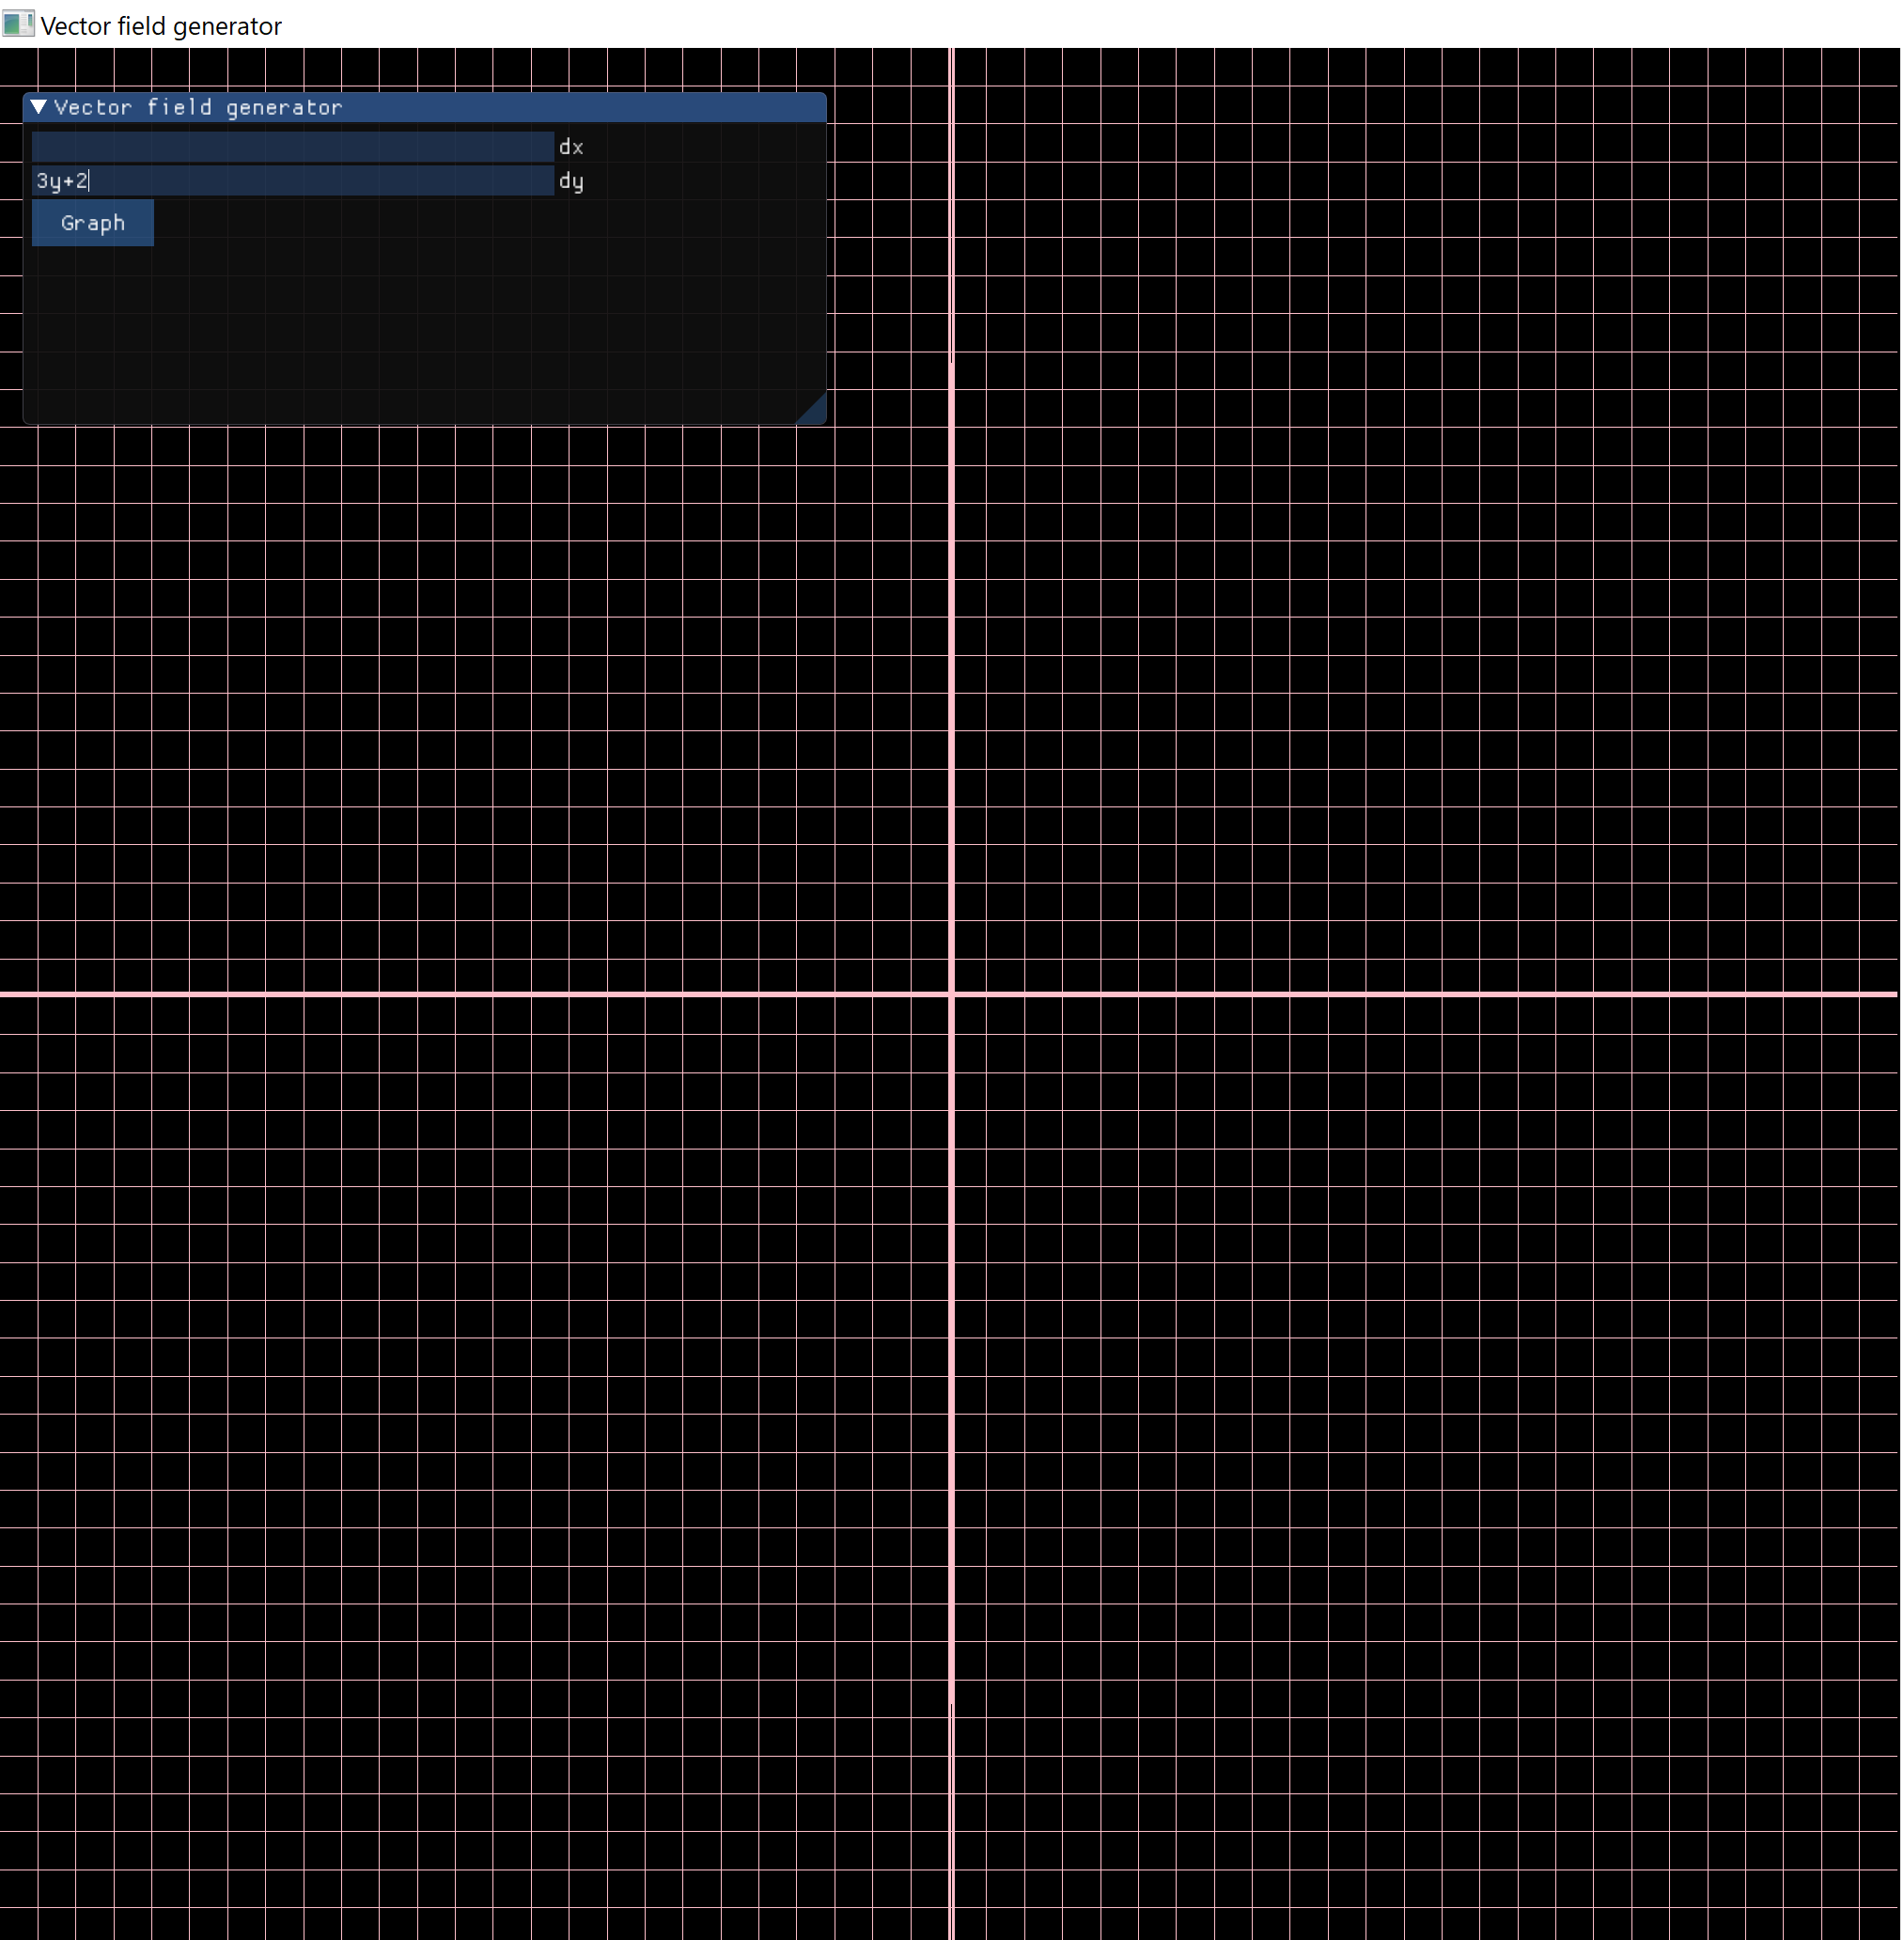
Differential Equations Vector Field Grapher
This is my current project. Uses C++ with OpenGL for graphics modelling.
The goal is to make something like this (choose ‘System’), where a user can enter two differential equations, have the cooresponding vector field appear, and then have the ability to click anywhere for solution curves to appear.
This uses a mathematical parser called Exprtk, the parser interprets the equations so they can be used beyond being just a string of numbers and letters (so you can plug in values, etc). Computation is via plugging in many values for x and y and provide outputs, then making these outputs into vectors and plotting them. For this I use Eulers method to get points to plot. User interface comes from a library called ImGui. As mentioned, uses OpenGL for rendering graphics directly from the GPU. Here is the code on GitHub.
Haven’t gotten vector rendering to work yet.
Wind vector plotter using an API using Python and Python graphics library
Using the speed and direction, (the components of velocity), you can find the the horizontal and vertical components of velocity vectors. This program graphs many of these vectors onto a map specifically for northwest Oregon, so one could view the wind behavior at this location. Uses the National Weather Service’s API. The program uses all of these longitudes and latitudes. This data is stored in a textfile that my code uses. Here is the code on GitHub.
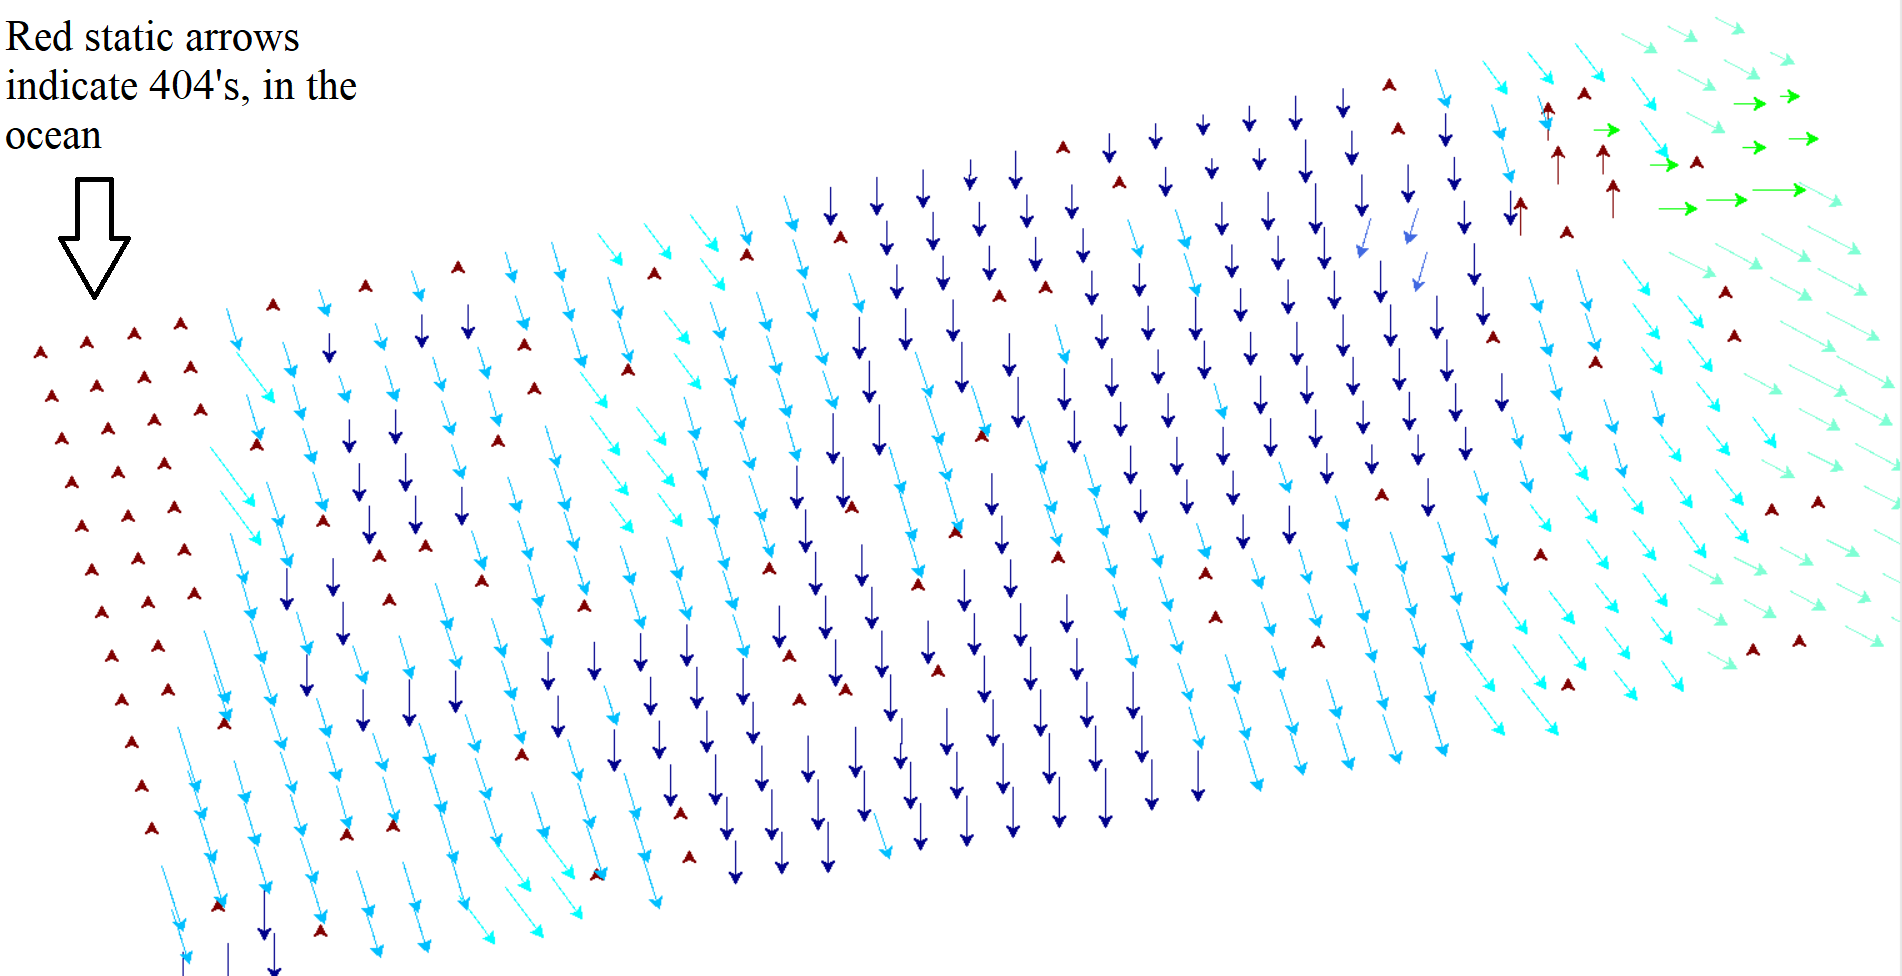
The wind vectors are visualized using a Python3 library called Turtles. Notice the red static arrows near the left side of the vector field, this is where the API is returning 404’s and no wind data can be recieved. This is because some coordinates used by the program exist in the ocean, and the API does not collect wind data here. The majority of the returned data is useful and velocity vectors can be created. In the screenshot below, you can notice that the colors of the vectors depend on the angle of the wind, while the length of the vectors depend on the speed of the wind. Blue toned colors coorespond to southern winds, while the (few) red vectors near the top right coorespond to northern winds:
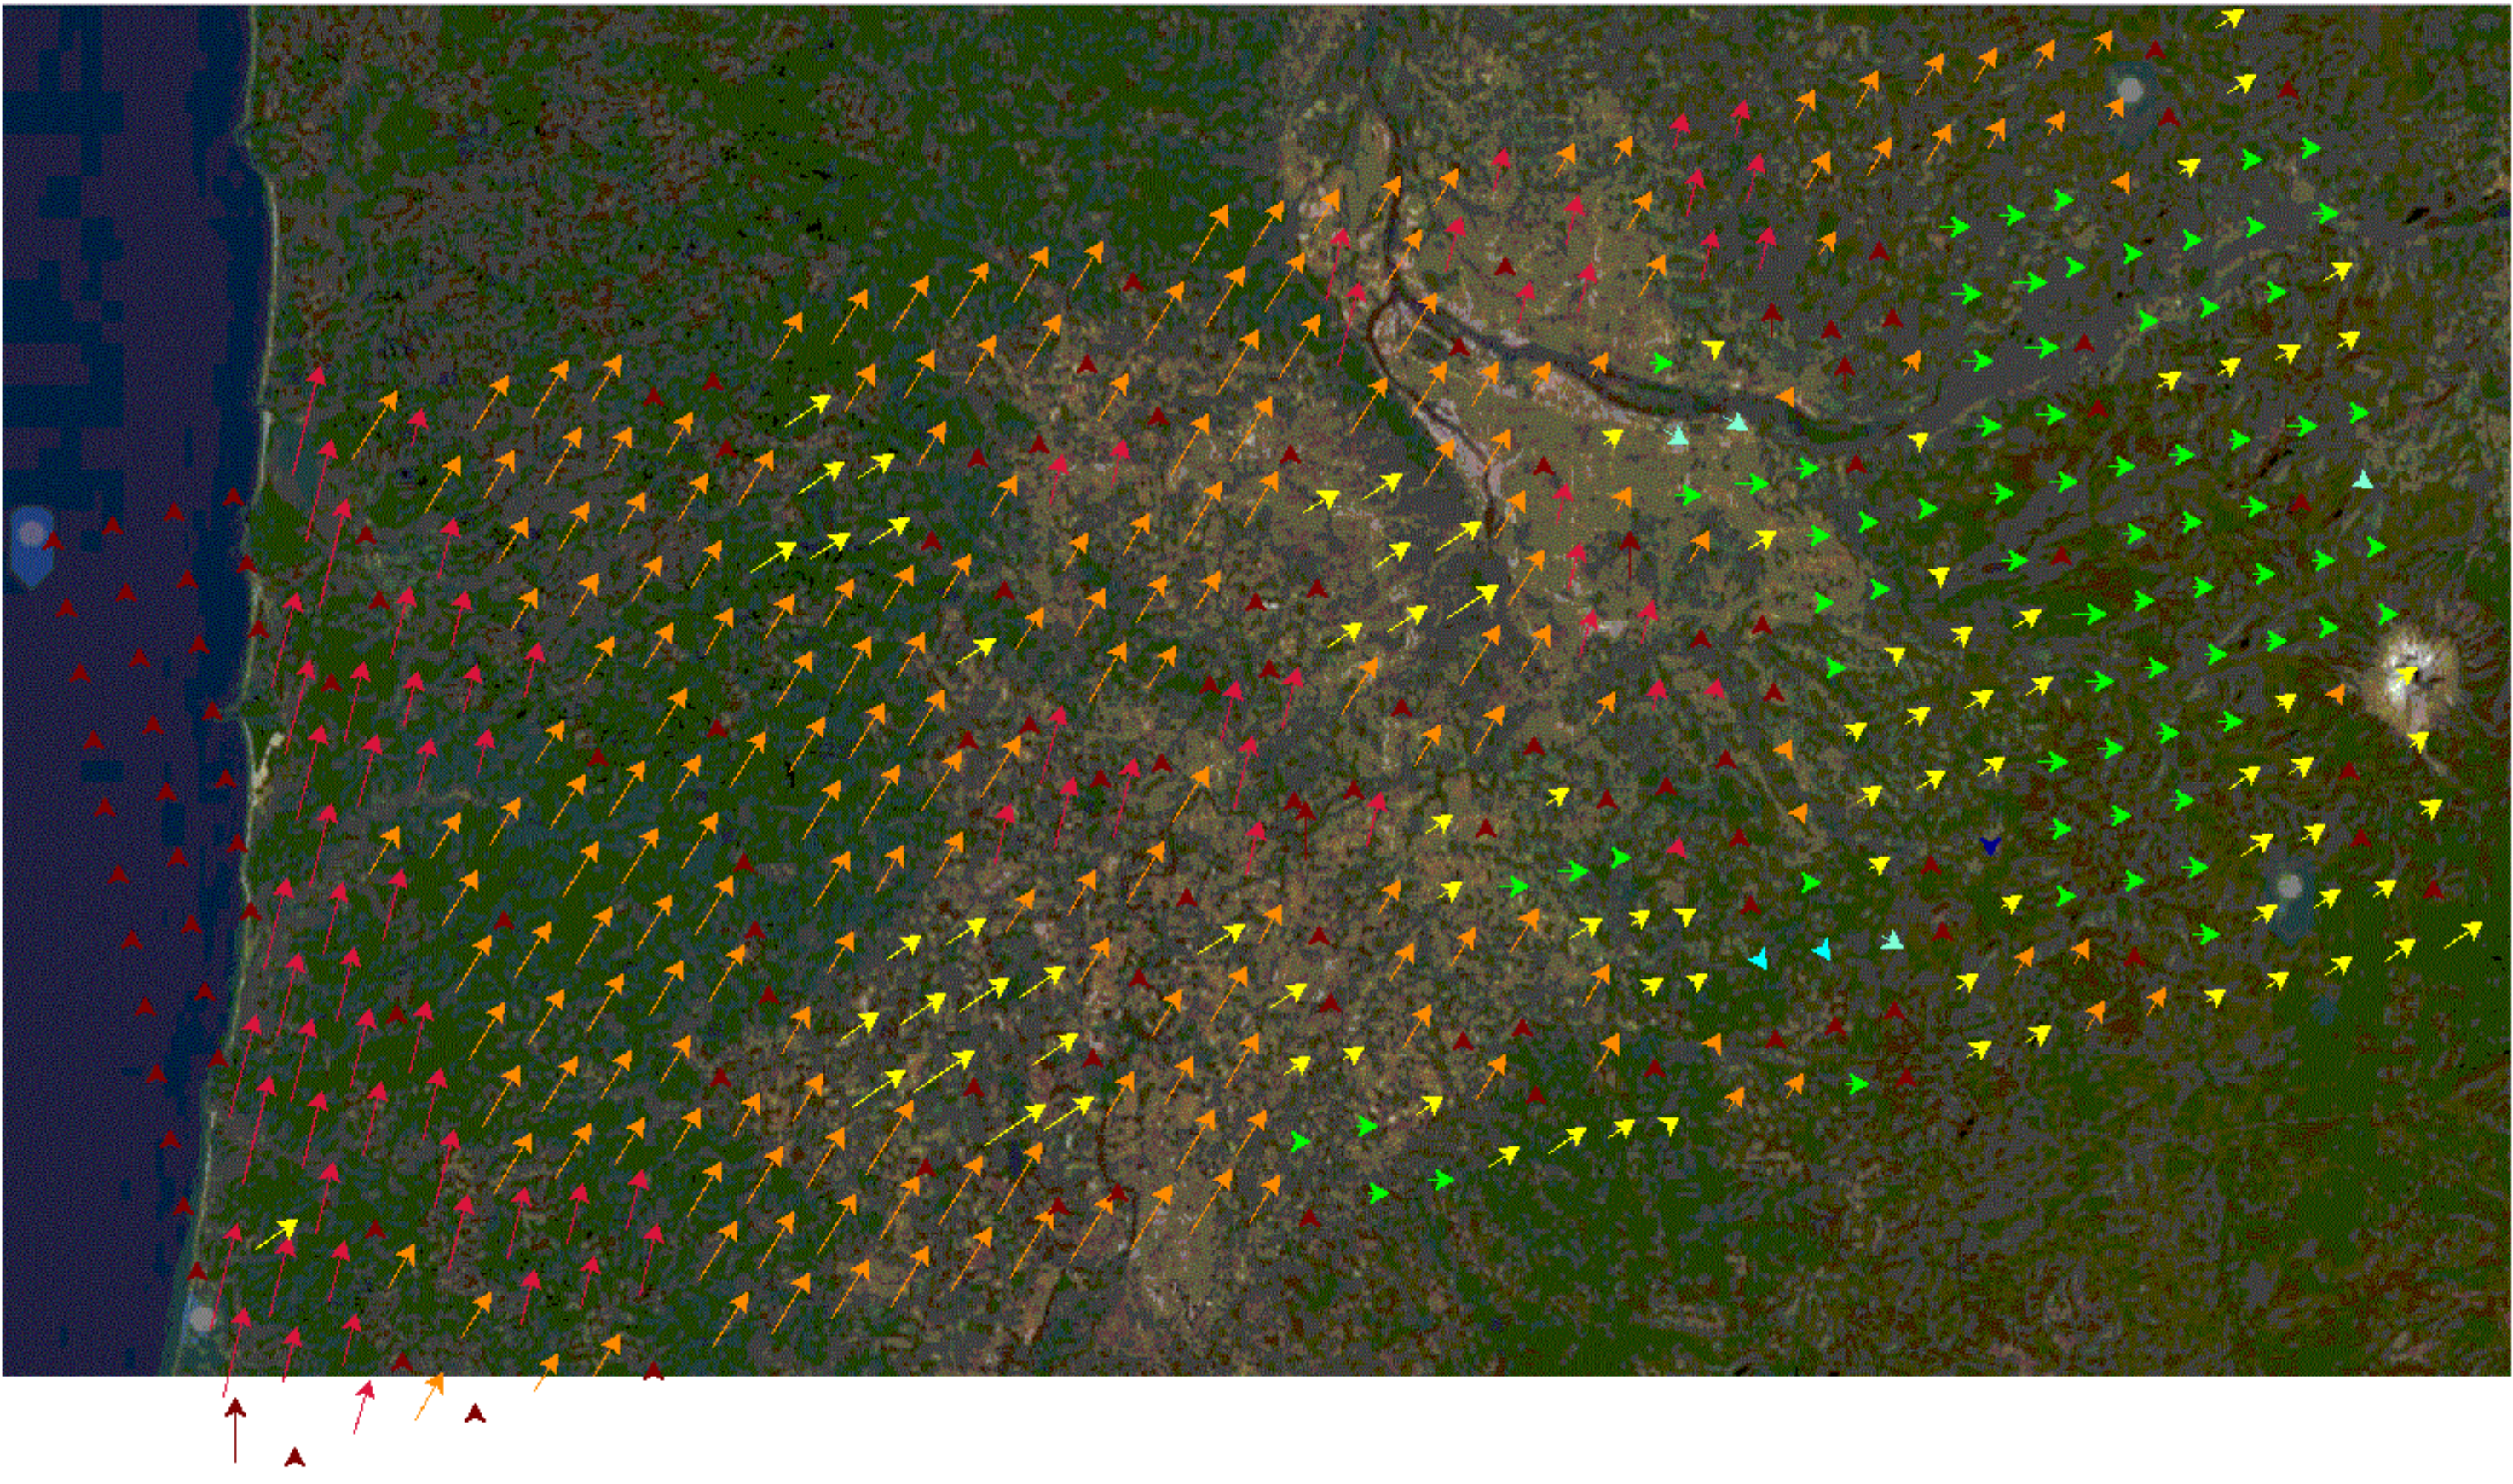
The above wind vectors cover the following little rectangular area of upper Northwest Oregon, (about 117 miles from bottom left to upper right, and 4,662 sq miles), from around Lincoln City (bottom left) to the middle of nowhere in southern Washington (top right) Here is an example run from 3/25/2021:
Below are scrapped projects
Wind vector plotter using an API using Unity (scrapped)
Scrapped and remade in Python (above). Scripts for this program can be viewed on my Github.
To-do:
- Implement a data structure (probably a linked list where the nodes are objects of a “weather” class) so I can plot hundreds of vectors onto a map.
- Allow the program to use these longitudes and latitudes for plotting vectors. I will most likely keep these inside a textfile and loop through as needed to plug into the API’s URL’s.
Volume of a Double Integral (scrapped because this is way over my head)
The main (very incomplete) project is a Unity application that deals with double integrals. In this case, there is a double integral of a function of two variables that the user may add limits of integration to. These integrals together with the limits represent the area (volume, because it’s 3-D) of the region bounded by the given function and four limits of integration. The program then graphs all given bounds and the function, then shades the correct region bounded by the function and all four limits. The scripts for this program are written in C#. There is also a UI where the user can enter upper and lower bounds.
Here is the resulting graphed upper & lower bounds of a few test bounds:
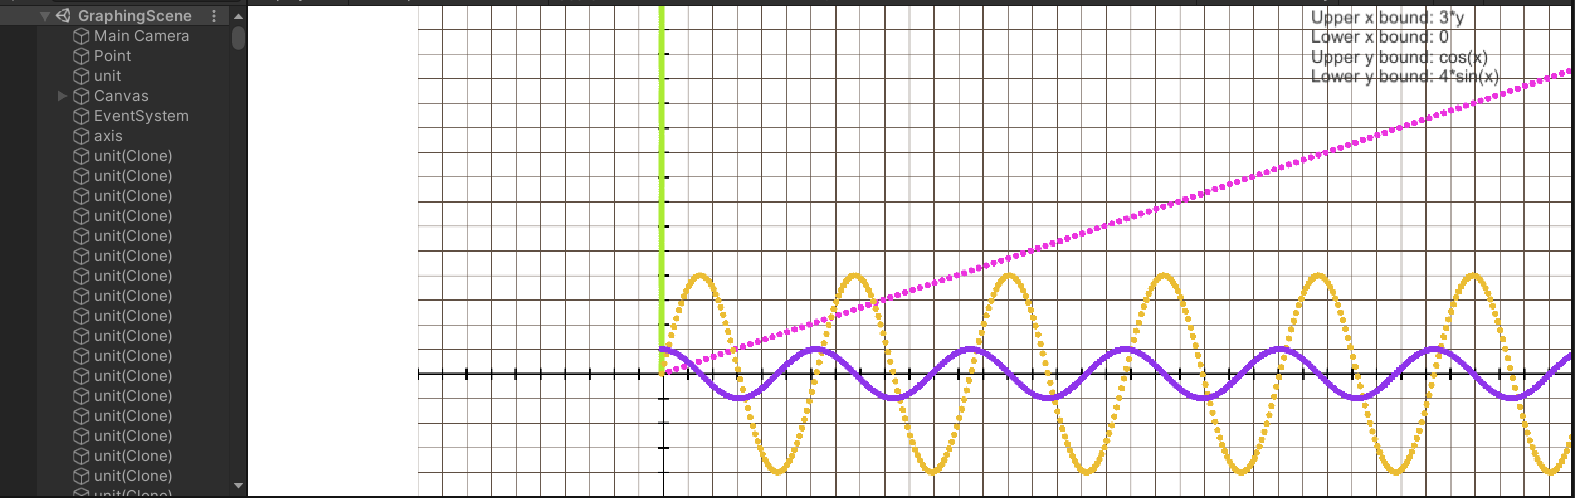
For this project, I am using the mXparser library for interpreting the mathematical expressions entered by the user. Scripts for this program can be viewed on my Github.
To-do:
-Implement region shading (hardest part)